Take your business reporting out of spreadsheets for good
Basic built-in reporting pushes you to spreadsheets. BlinkMetrics® pulls raw data from your business tools and we build live dashboards for you (with the answers you actually need)
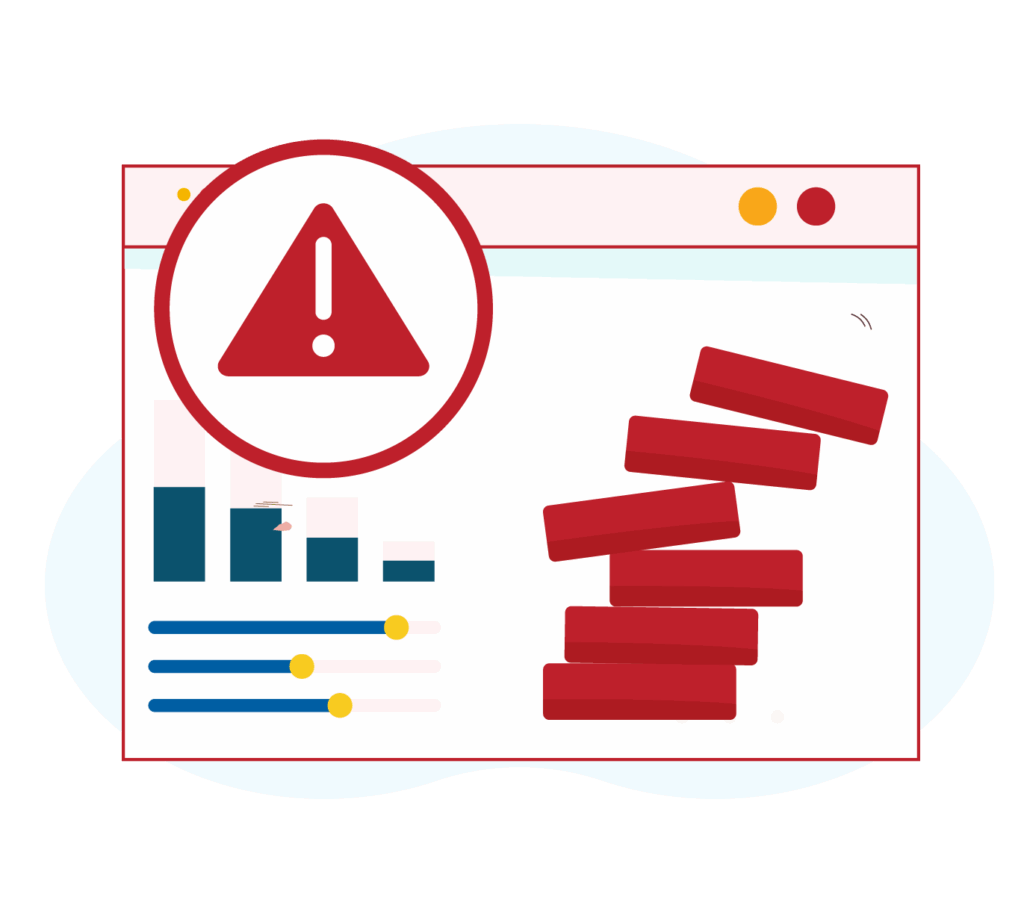
Spreadsheets get you close, but they won't get you all the way
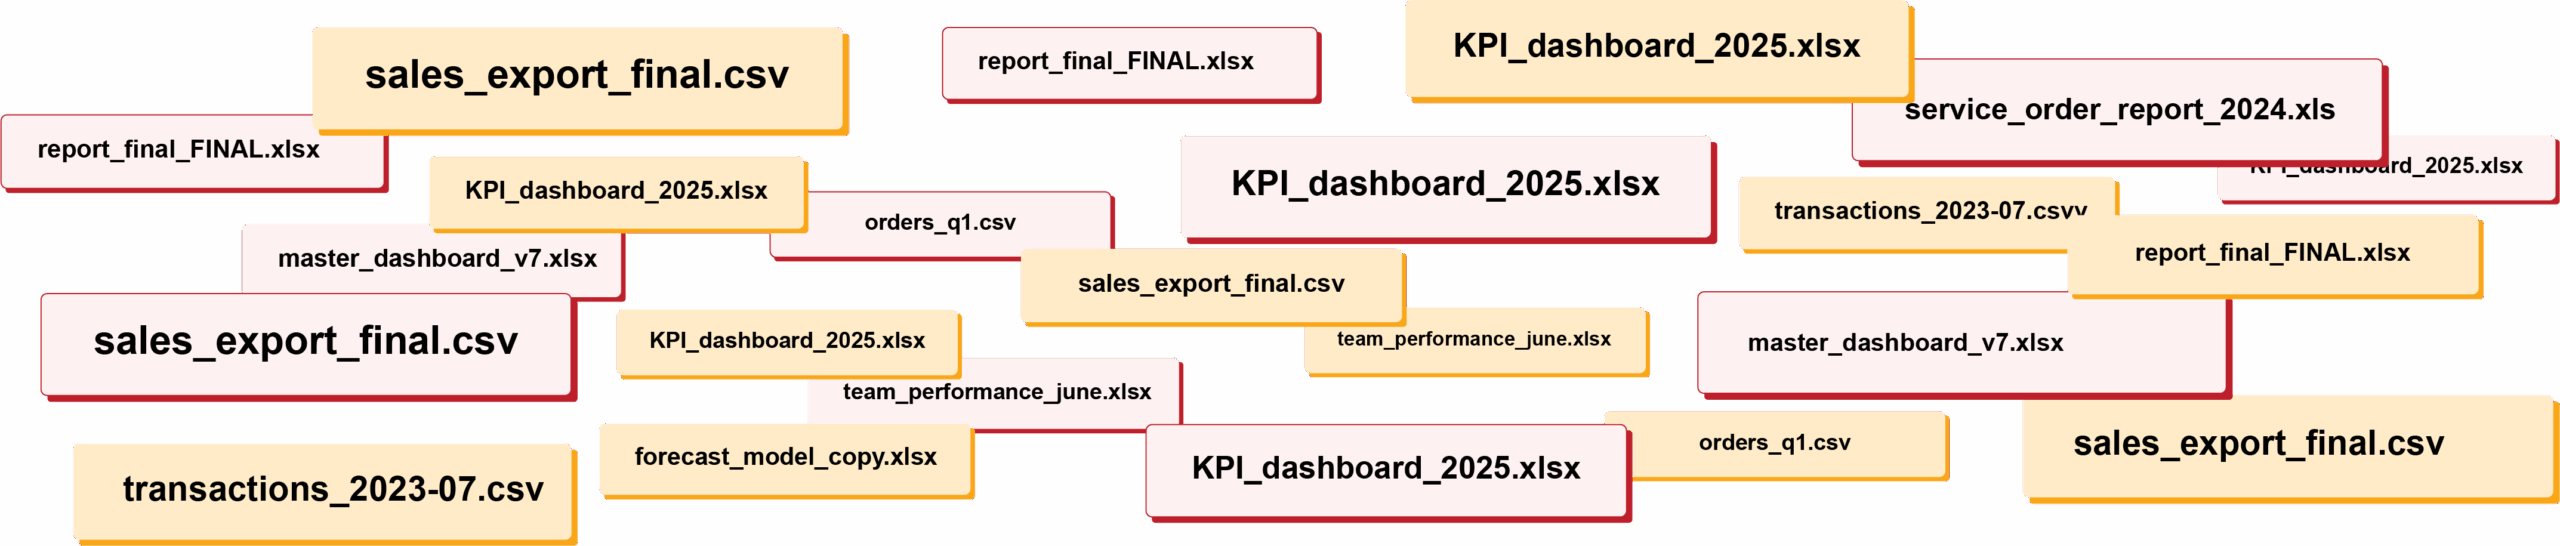
Endless CSV Exports
Hours to find an answer
Broken links, Zaps & formulas
Numbers are difficult to verify
Everything breaking as you scale
RIP spreadsheets. BlinkMetrics brings your
reporting into live dashboards that show what’s
really happening in your business.
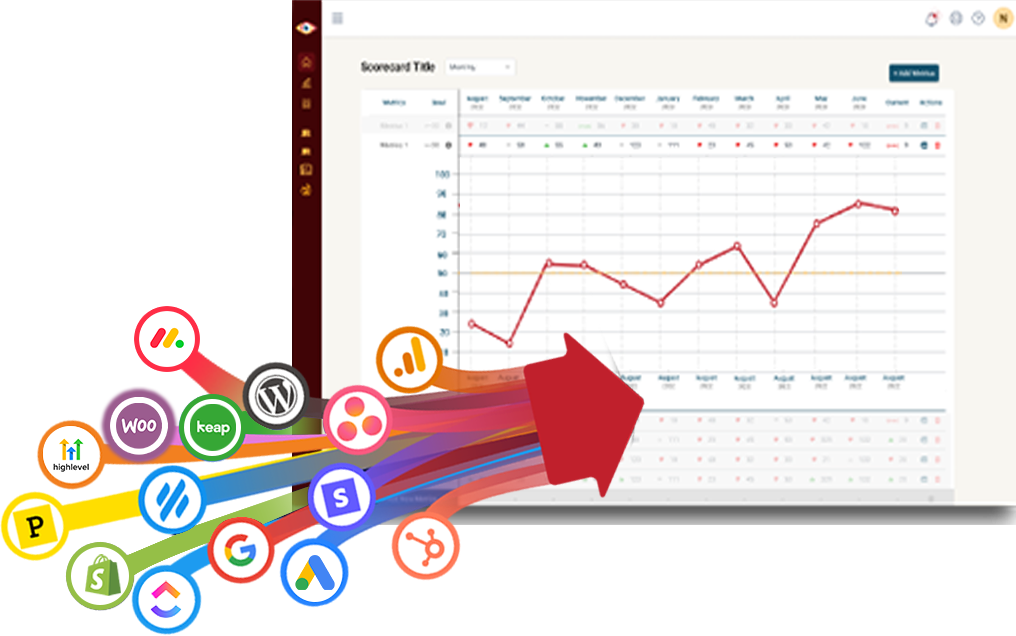
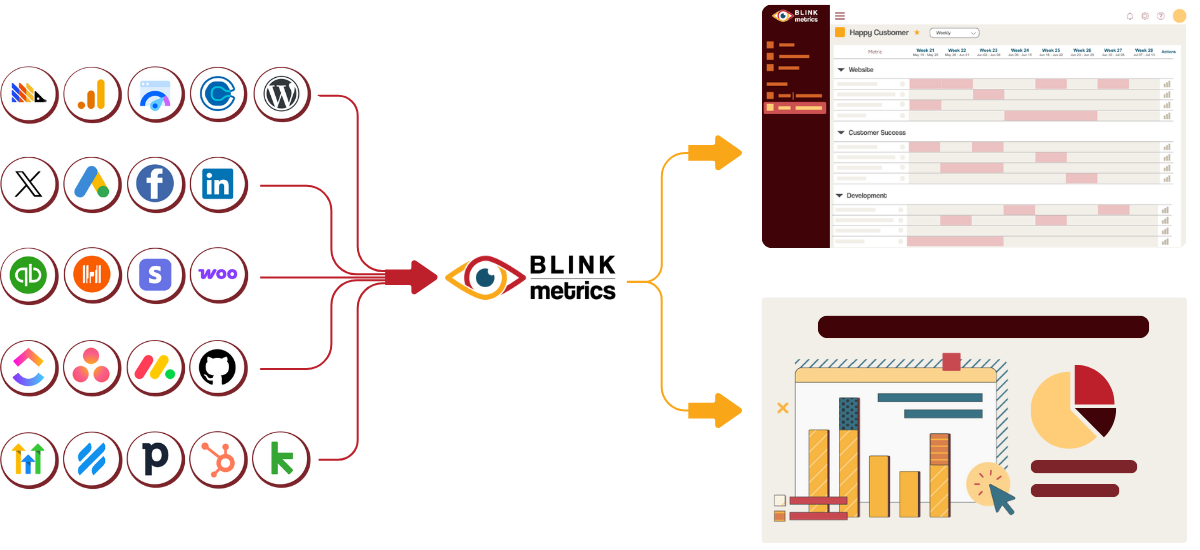
Easily connect to any business tool you use
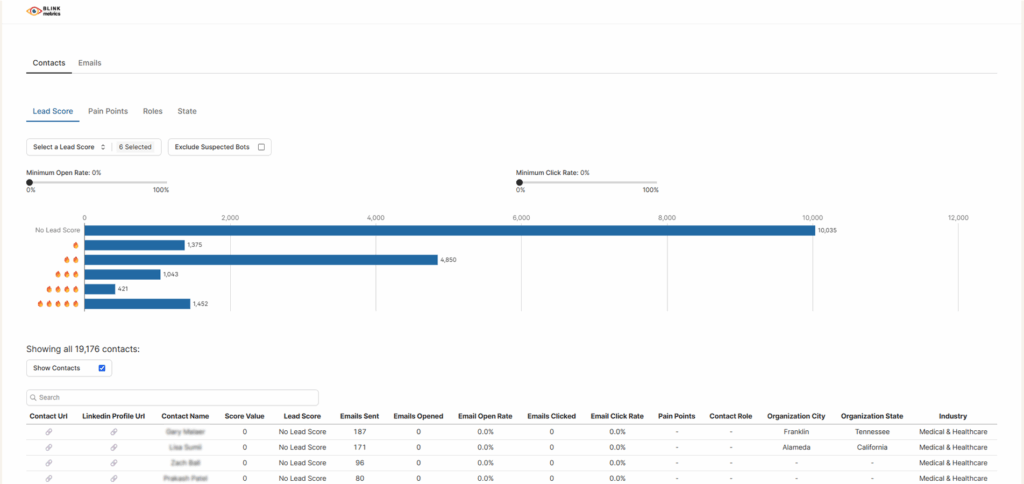
We capture raw data from any platform and keep it updated continuously. You’ll always have the live numbers, full history, and ability to drill into any KPI for the details that explain it.
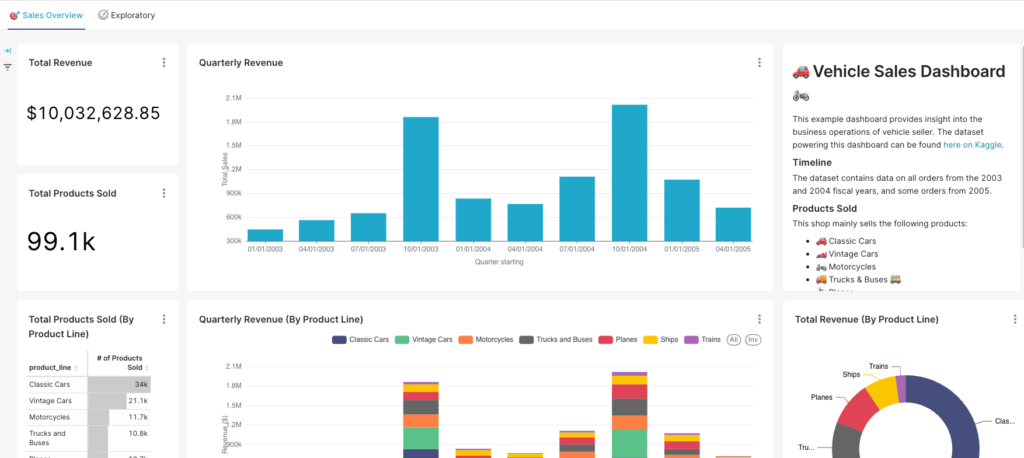
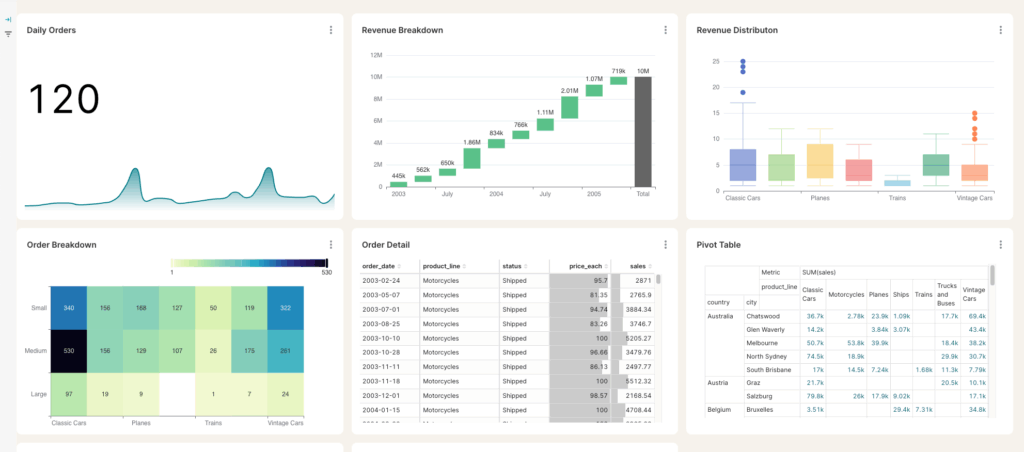
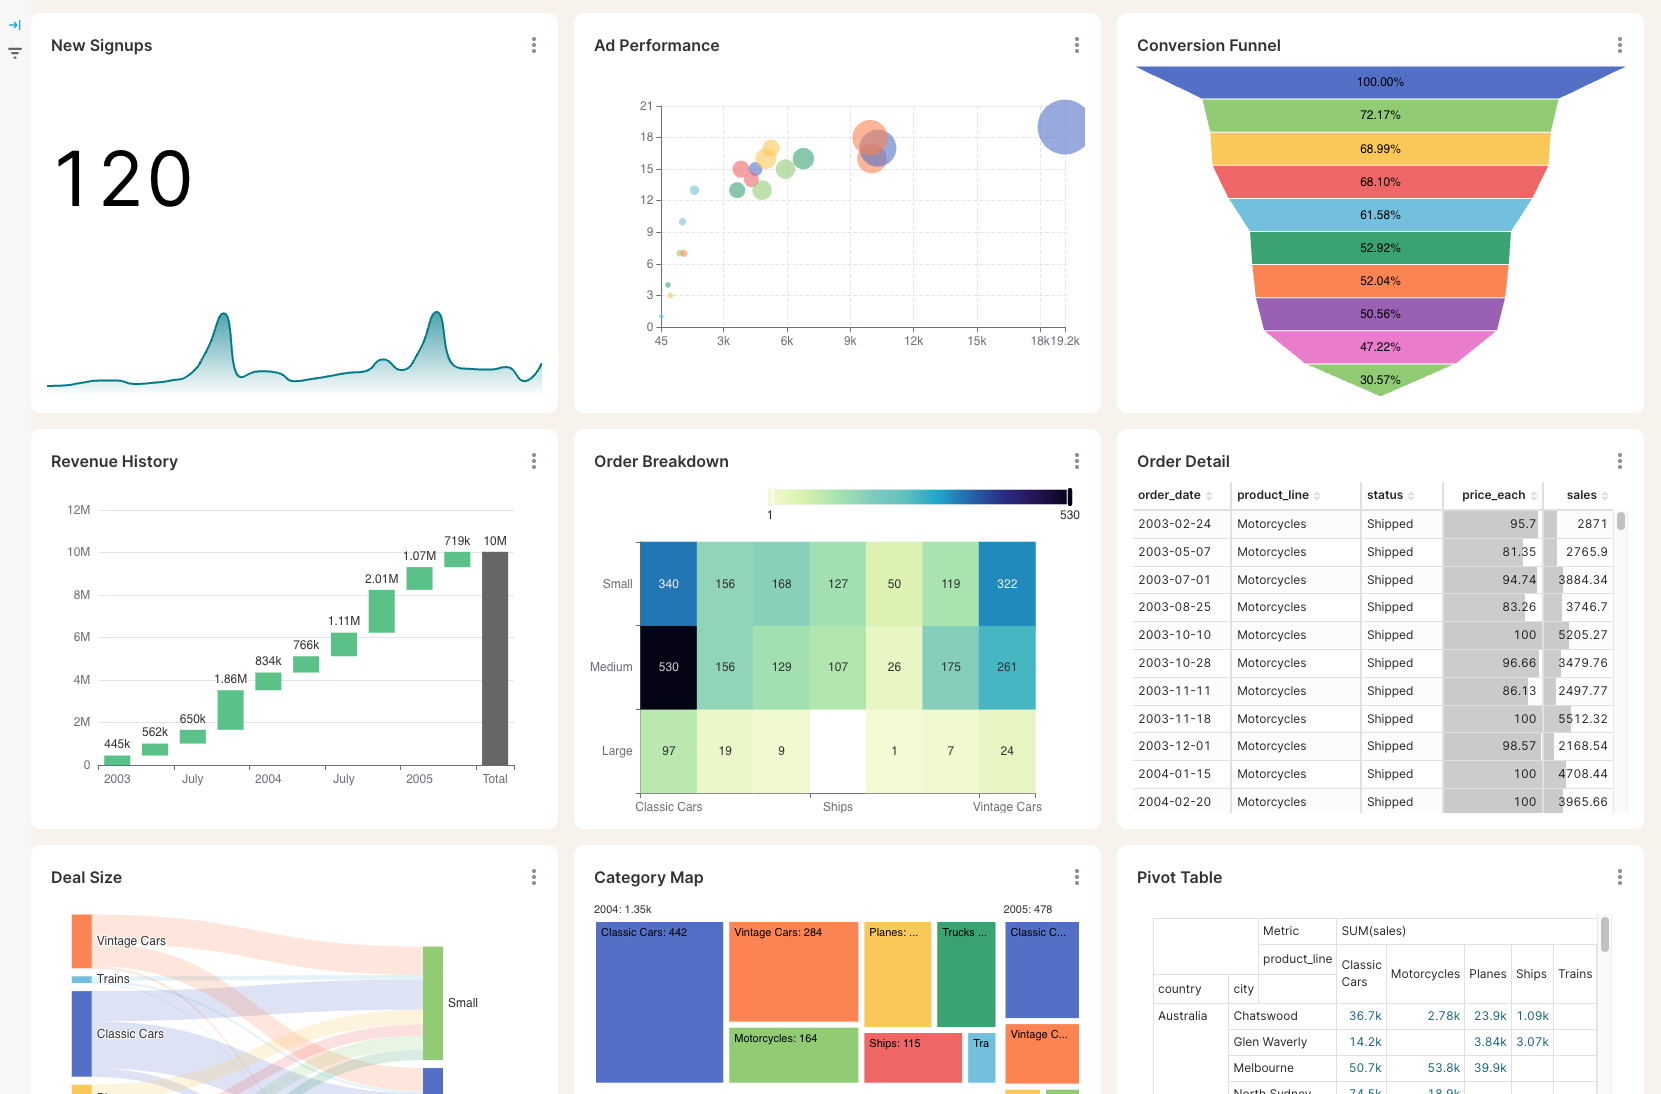
Get the reporting you
never could before
Access custom reports with interactive dashboards & scorecards, giving you answers to questions you’ve never been able to answer easily. Look deeper into any number, explore trends, and slice & dice results by any segment.
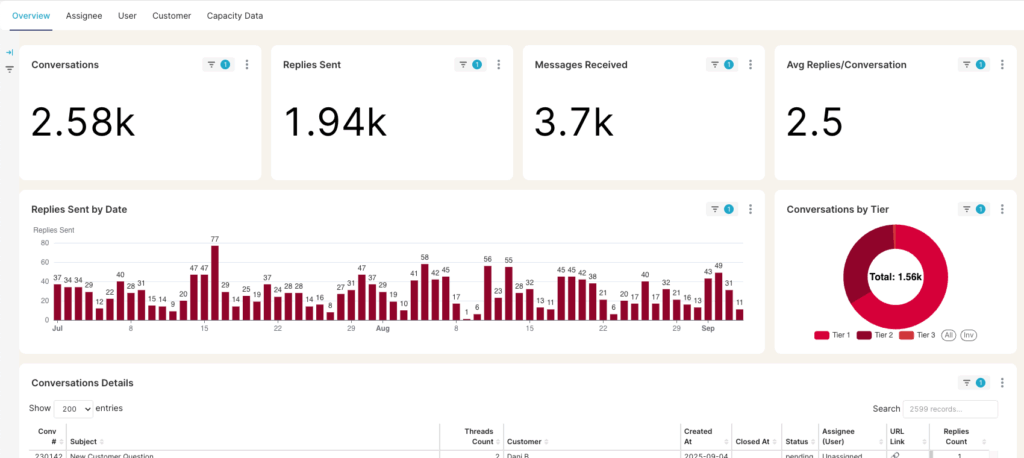
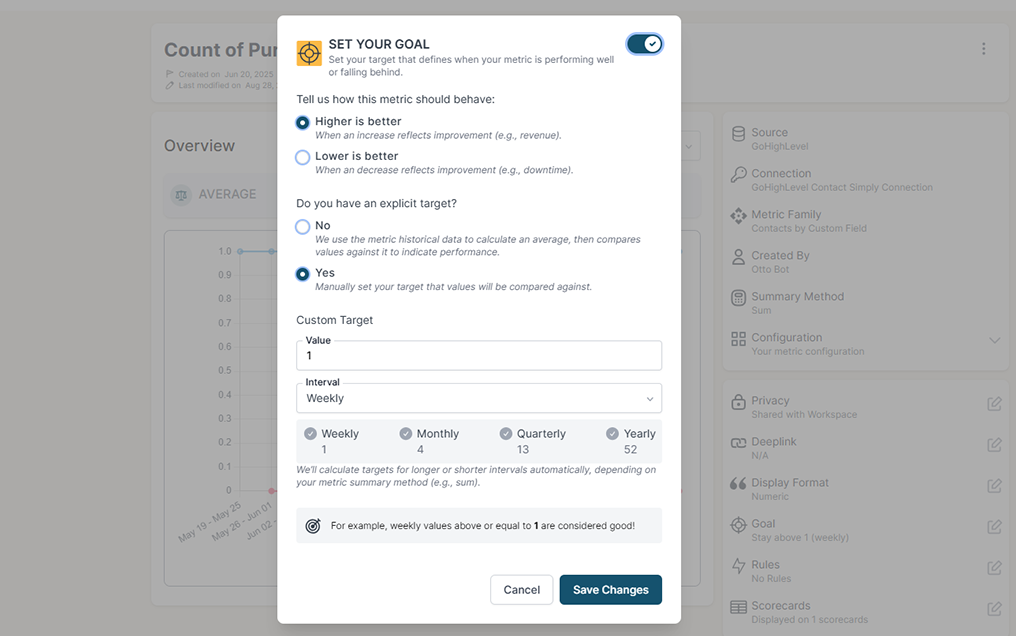
Stay on track with real
time visibility & alerts
Set clear goals, track progress in real time, and get alerts the moment a KPI slips or beats target. Acting proactively & not reactively means you’re no longer the last to know.
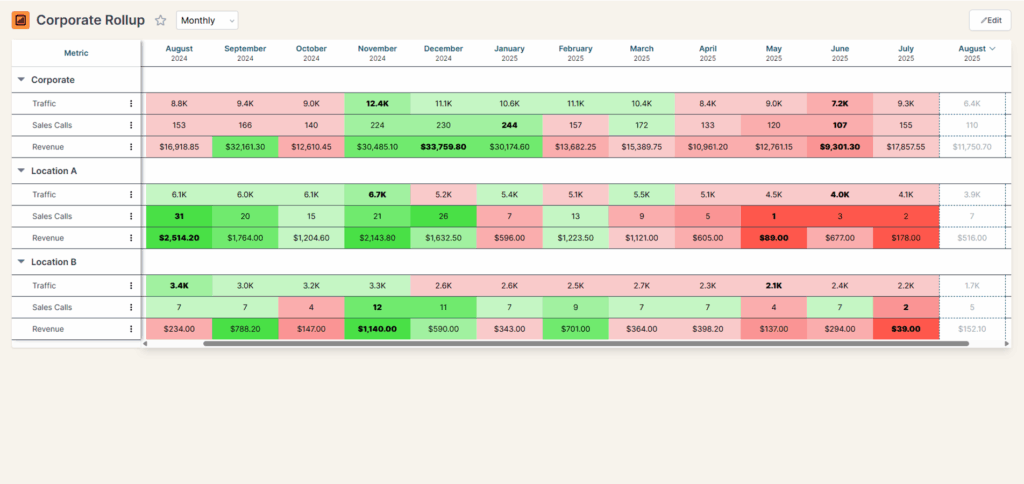
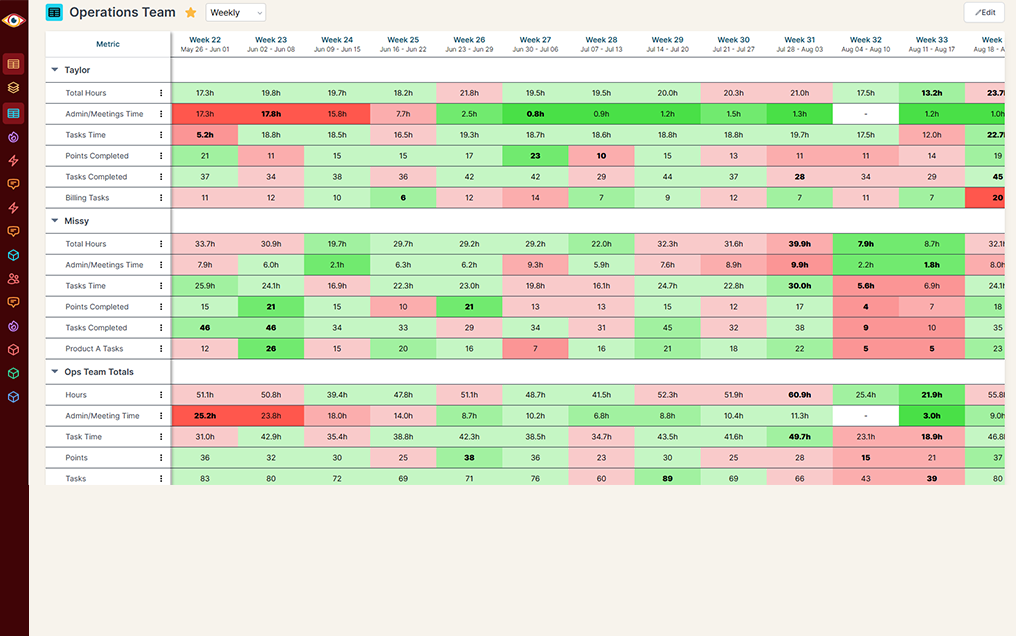
Keep your team in the loop and accountable
Keep goals front and center with reports designed for each person, team, or location -shared in real time to keep performance transparent and encourage accountability.
The answers small businesses need are within reach with BlinkMetrics
(no 6-figure budget required)
“This is an asset for the business that gives us data analysis across millions and millions of data points. ”
Erik Jensen
Chief Strategy Officer
Replace your messy web of spreadsheets in 30 days
How to get started with BlinkMetrics
Day 1
Day 15
Day 30
Kick-off call
Tell us your biggest frustrations and what questions you need answered.
We build it for you
We’ll connect your data, then build out your dashboards and scorecards
You finally have answers
Make confident, data-driven decisions with reporting that make sense.
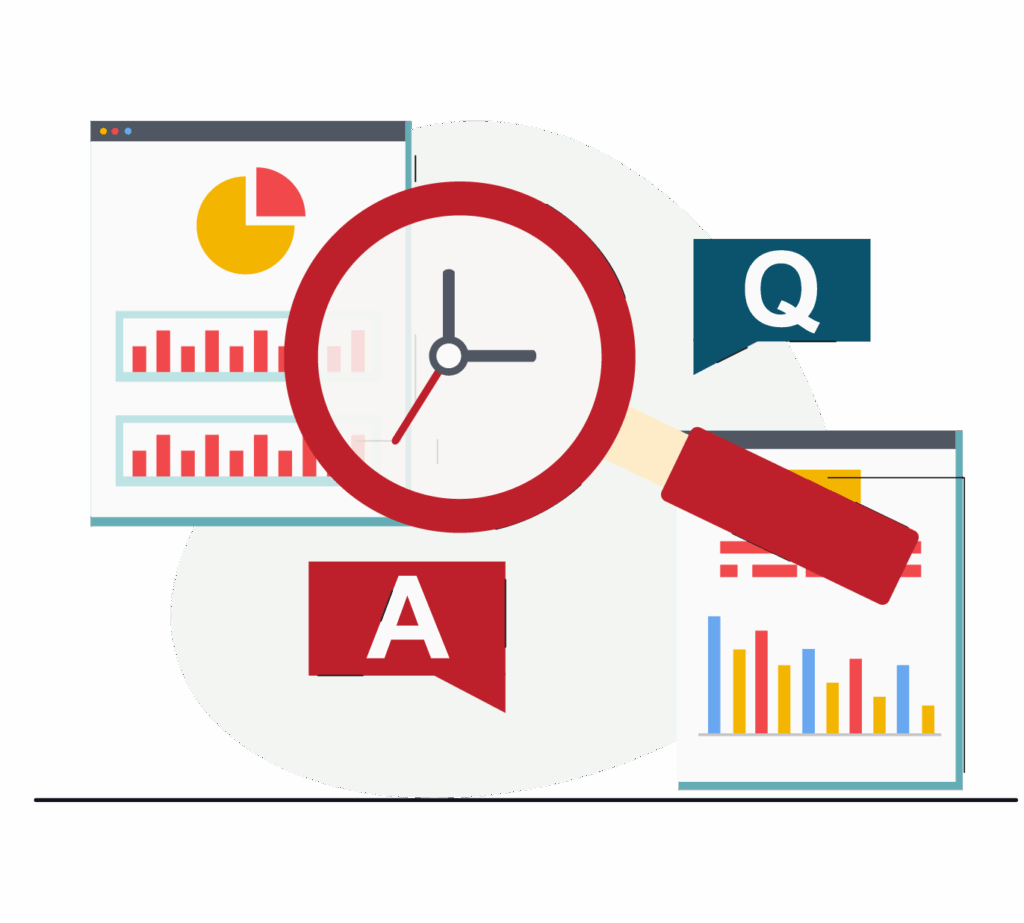
You’re not alone — here are the ones we hear most often.
How is this different from using spreadsheets?
BlinkMetrics moves you out of static, error-prone spreadsheets and into live, automated dashboards. We connect directly to your data sources, update everything continuously, and give you interactive reports with segmenting and drill-down capabilities—eliminating manual exports, broken formulas, and the chaos of version control.
How long does it take to set up?
Our customers are up and running with their core dashboards in less than 30 days. After an initial kick-off call, our team handles 100% of the setup for you. You don’t need to waste valuable time learning or building anything yourself.
Do I need a developer or IT team to integrate this?
Nope. Our team handles the technical integration for you. We simply need access to your business tools (like your CRM, ad platforms, or database). There’s no coding, scripting, or developer resources required on your end.
What tools and platforms can you connect to?
We connect to all the essential tools that drive SMBs, including
Marketing (like Google Analytics, Calendly, WordPress)
If you use a specific tool or even a proprietary application, just ask—we can likely connect to it.
My data is sensitive. How do you handle security?
Data security is our top priority. Every customer gets their own isolated data warehouse and we use industry-standard encryption (both in transit and at rest). API keys are stored in a secrets manager, we comply with major data protection regulations, and offer robust access controls. Our access is read-only for reporting; we never alter or delete any data in your source systems.
We also have the ability to remove/anonymize data before it even enters the data warehouse. Many reporting needs don’t rely on that sensitive data.
We can provide read access to your data warehouse to verify that all sensitive data is redacted and compliant with your requirements.
What if I need to track a new KPI or change a report?
Unlike static spreadsheets, our granular data capture means you can define new KPIs and build new reports at any time, without needing to reconfigure your data pipelines. Your historical data is always available for new analysis.
We can train your team to make edits or continue to make changes for you.
Can I cancel anytime?
Yes. All standard plans are month-to-month – no contracts, cancel anytime.
I'm looking forward to meeting you and learning all about your business!